
Research Process: The research process is like undertaking a journey. For a research journey, there are two crucial decisions to make:
- What you want to find out about or what research questions (problems) you want to find answers to;
- How to go about finding their answers?
There are practical steps through which you must pass on your research journey to find answers to your research questions.
The path to finding answers to your research questions constitutes research methodology.
At each operational step in the research process, you are required to choose from a multiplicity of methods, procedures, and models of research methodology, which will help you to best achieve your objectives.
UNIT – II: Research Aptitude (Click below on the topic to read the study notes)
|
Steps in Research Process
- Formulating the Research Problem
- Extensive Literature Review
- Developing the Objectives
- Preparing the Research Design including Sample Design
- Collecting the Data
- Processing and Analysis of Data
- Preparation of the Report or Presentation of Results (Formal write-ups of conclusions reached)
Step 1. Formulating Research Problem
It is the first and most crucial step in the research process. The main function is to decide what you want to find out about.
Sources of research problems: Research in social sciences revolves around four Ps:
- People: a group of individuals
- Problems: examine the existence of certain issues or problems relating to their lives; to ascertain the attitude of a group of people towards an issue
- Programs: to evaluate the effectiveness of an intervention
- Phenomena: to establish the existence of regularity.
In practice, most research studies are based upon at least a combination of two Ps.
Every research study has two aspects:
Study population:
- People: individuals, organizations, groups, communities. (They provide you with the information or you collect information about them)
Subject area:
- Problems: issues, situations, associations, needs, profiles
- Program: content, structure, outcomes, attributes, satisfactions, consumers, Service providers, etc.
- Phenomenon: cause-and-effect relationships, the study of a phenomenon itself (Information that you need to collect to find answers to your research questions)
You can examine the professional field of your choice in the context of the four Ps in order to identify anything that looks interesting.
Considerations in selecting a research problem:
These help to ensure that your study will remain manageable and that you will remain motivated.
- Interest: a research endeavour is usually time-consuming and involves hard work and possibly unforeseen problems. One should select a topic of great interest to sustain the required motivation.
- Magnitude: It is extremely important to select a topic that you can manage within the time and resources at your disposal. Narrow the topic down to something manageable, specific and clear.
- Measurement of concepts: Make sure that you are clear about the indicators and measurement of concepts (if used) in your study.
- Level of expertise: Make sure that you have an adequate level of expertise for the task you are proposing since you need to do the work yourself.
- Relevance: Ensure that your study adds to the existing body of knowledge, bridges current gaps and is useful in policy formulation. This will help you to sustain interest in the study.
- Availability of data: Before finalizing the topic, make sure that data are available.
- Ethical issues: How ethical issues can affect the study population and how ethical problems can be overcome should be thoroughly examined at the problem formulating stage.
Steps in Formulation of a Research Problem:
Working through these steps presupposes a reasonable level of knowledge in the broad subject area within which the study is to be undertaken. Without such knowledge, it is difficult to clearly and adequately ‘dissect’ a subject area.
- Step 1: Identify a broad field or subject area of interest to you.
- Step 2: Dissect the broad area into subareas.
- Step 3: Select what is of most interest to you.
- Step 4: Raise research questions.
- Step 5: Formulate objectives.
- Step 6: Assess your objectives.
- Step 7: Doublecheck.
So far, we have focused on the basis of your study, the research problem. But every study in social sciences has a second element, the study population from whom the required information to find answers to your research questions is obtained.
As you narrow the research problem, similarly, you need to decide very specifically, who constitutes your study population, in order to select the appropriate respondents.
Step 2. Reviewing the Literature
- The essential preliminary task in order to acquaint yourself with the available body of knowledge in your area of interest.
- A literature review is an integral part of the entire research process and makes valuable contribution to every operational step.
- Reviewing literature can be time-consuming, daunting and frustrating, but is also rewarding.
Its functions are:
- Bring clarity and focus to the research problem;
- Improve methodology;
- Broaden knowledge;
- Contextualise findings.
Bring clarity and focus to the research problem:
The process of reviewing the literature helps you to understand the subject area better and thus helps you to conceptualise your research problem clearly and precisely. It also helps you to understand the relationship between your research problem and the body of knowledge in the area.
Improve methodology:
A literature review tells you if others have used procedures and methods similar to the ones that you are proposing, which procedures and methods have worked well for them, and what problems they have faced with them. Thus, you will be better positioned to select a methodology that is capable of providing a valid answer to your research questions.
Broaden knowledge base in the research area:
It ensures you to read widely around the subject area in which you intend to conduct your research study. As you are expected to be an expert in your area of study, it helps fulfil this expectation. It also helps you to understand how the findings of your study fit into the existing body of knowledge.
Contextualise findings:
How do answers to your research questions compare with what others have found? What contribution have you been able to make into the existing body of knowledge? How are your findings differ from those of others? For you to be able to answer these questions, you need to go back to your literature review. It is important to place your findings in the context of what is already known in your field of enquiry.
Procedure for reviewing the literature:
- Search for existing literature in your area of study;
- review the literature selected;
- develop a theoretical framework;
- develop a conceptual framework.
Step 3 – Formulation of Objectives (Hypothesis)
- Objectives are the goals you set out to attain in your study.
- They inform a reader what you want to attain through the study.
- It is extremely important to word them clearly and specifically.
Objectives should be listed under two headings:
- Main objectives (aims);
- Sub-objectives.
The main objective is an overall statement of the thrust of your study. It is also a statement of the main associations and relationships that you seek to discover or establish.
The sub-objectives are the specific aspects of the topic that you want to investigate within the main framework of your study.
- They should be numerically listed.
- Wording should clearly, completely and specifically communicate to readers.
- Each objective should contain only one aspect of the Study.
- Use action-oriented words or verbs when writing objectives.
Identifying Variables:
In a research study, it is important that the concepts used should be operationalised in measurable terms so that the extent of variations in respondents’ understanding is reduced if not eliminated.
Techniques about how to operationalise concepts, and knowledge about variables, play an important role in reducing this variability.
Their knowledge, therefore, is important in ‘fine-tuning’ your research problem.
For example:
- ‘Jet Airways’ is a perfect example of quality cabin service.
- Food in this restaurant is
- The middle class in India is getting more
When people express these feelings or preferences, they do so on the basis of certain criteria in their minds. Their judgement is based upon indicators that lead them to conclude and express that opinion.
These are judgements that require a sound basis on which to proclaim. This warrants the use of a measuring mechanism and it is in the process of measurement that knowledge about variables plays an important role.
Variable
An image, perception or concept that can be measured – hence capable of taking on different values– is called a variable.
Concept
Concepts are mental images or perceptions, and therefore, their meaning varies markedly from individual to individual.
Difference between Concept and Variable:
A concept cannot be measured whereas a variable can be subjected to measurement by crude/refined or subjective/objective units of measurement. It is therefore important for the concept to be converted into variables.
| Concept | Variable |
| · Subjective impression · No uniformity as to its understanding among different people · As such cannot be measured | · Measurable though the degree of precision varies from scale to scale and from variable to variable (e.g. attitude – subjective, income – objective) |
| Examples; · Effectiveness · Satisfaction · Impact · Excellent · High achiever · Self-esteem · Rich · Domestic violence · Extent and pattern of alcohol consumption, etc. | Examples; · Gender (male/female) · Attitude · Age (x years, y months) · Income ($ __ per year) · Weight ( __ kg) · Height ( __ cm) · Religion (Catholic, protestant, Jew, Muslim), etc. |
Measurement of Scales (Types of DATA)
There are four types of data that may be gathered in social research, each one adding more to the next. Thus, ordinal data is also nominal, and so on.
A useful acronym to help remember this is NOIR (French for ‘black’).
Nominal or Categorical:
A nominal scale enables the classification of individuals, objects or responses into subgroups based on a common/shared property or characteristic. A variable measured on a nominal scale may have one, two, or more subcategories depending upon the extent of variation.
For example: ’water’ or ‘tree’ has only one subgroup, whereas the variable “gender” can be classified into two sub-categories: male and female. ‘Hotels’ can be classified into —- sub-categories.
The sequence in which subgroups are listed makes no difference as there is no relationship among subgroups. Nominal items are usually categorical, in that they belong to a definable category, such as ’employees’.
Ordinal or Ranking Scale:
Besides categorizing individuals, objects, responses or property into subgroups on the basis of common characteristic, it ranks the subgroups in a certain order. They are arranged either in ascending or descending order according to the extent a subcategory reflects the magnitude of variation in the variable.
For example: ‘income’ can be measured either quantitatively (in rupees and paise) or qualitatively using subcategories ‘above average’, ‘average’ and ‘below average’. The ‘distance’ between these subcategories are not equal as there is no quantitative unit of measurement. ‘Socioeconomic status’ and ‘attitude’ are other variables that can be measured on an ordinal scale.
Interval Scale:
An interval scale has all the characteristics of an ordinal scale. In addition, it uses a unit of measurement with an arbitrary starting and terminating points.
For example:
Celsius scale: 0*C to 100*C
Fahrenheit scale: 32*F to 212*F
Attitudinal scales: 10-20
21-31
31-40 etc
Ratio Scale:
A ratio scale has all the properties of nominal, ordinal, and interval scales plus its own property: the zero point of a ratio scale is fixed, which means it has a fixed starting point. Since the difference between intervals is always measured from a zero point, this scale can be used for mathematical operations.
The measurement of variables like income, age, height, and weight are examples of this scale. A person who is 40 years old is twice as old as one who is 20 years old.
Parametric vs. Non-parametric:
Interval and ratio data are parametric and are used with parametric tools in which distributions are predictable (and often Normal).
Nominal and ordinal data are non-parametric and do not assume any particular distribution. They are used with non-parametric tools such as the Histogram.
Continuous and Discrete Variables:
Continuous Variables are measured along a continuous scale, which can be divided into fractions, such as temperature. Continuous variables allow for infinitely fine sub-division, which means if you can measure sufficiently accurately, you can compare two items and determine the difference.
Discrete variables are measured across a set of fixed values, such as age in years (not microseconds). These are commonly used on arbitrary scales, such as scoring your level of happiness, although such scales can also be continuous.
Constructing Hypotheses:
As a researcher, you do not know about a phenomenon, but you do have a hunch to form the basis of certain assumptions or guesses. You test these by collecting information that will enable you to conclude if your notion was right.
The verification process can have one of the three outcomes. Your hunch may prove to be:
- Right;
- partially right; or
- Wrong
Without this process of verification, you cannot conclude anything about the validity of your assumption.
Hence, a hypothesis is an intelligent guess, hunch, assumption, suspicion, assertion, or an idea about a phenomenon, relationship, or situation, the reality or truth of which you do not know. A researcher calls these assumptions/ hunches hypotheses, and they become the basis of an inquiry.
In most studies, the hypotheses will be based upon your own or someone else’s observation.
Hypotheses bring clarity, specificity, and focus on a research problem, but are not essential for a study.
- You can conduct a valid investigation without constructing formal hypotheses.
Functions of Hypotheses:
- The formulation of the hypothesis provides a study with focus. It tells you what specific aspects of a research problem to investigate.
- A hypothesis tells you what data to collect and what not to collect, thereby providing focus to the study.
- As it provides a focus, the construction of a hypothesis enhances objectivity in a study.
- A hypothesis may enable you to add to the formulation of a theory. It allows you to conclude what is true or what is false accurately.
Types of Hypotheses
- Null Hypotheses
- Alternative Hypotheses
Null Hypotheses: A null hypothesis is a type of hypothesis used in statistics that proposes that no statistical significance exists in a set of given observations. The null hypothesis attempts to show that no variation exists between variables or that a single variable is no different than its mean. It is presumed to be true until statistical evidence nullifies it for an alternative hypothesis.
Alternative Hypotheses: The alternate hypothesis is just an alternative to the null. For example, if your null is “I’m going to win up to $1000” then your alternate is “I’m going to win more than $1000.” Basically, you’re looking at whether there’s enough change (with the alternate hypothesis) to be able to reject the null hypothesis.
Step 4 – Preparing Research Design
Research design is the conceptual structure within which research would be conducted.
The function of the research design is to provide for the collection of relevant information with minimal expenditure of effort, time, and money.
The preparation of research design, appropriate for a particular research problem, involves the consideration of the following:
- Objectives of the research study.
- Method of Data Collection to be adopted
- Source of information (Sample Design)
- Tool for Data collection
- Data Analysis– qualitative and quantitative
Objectives of the Research Study: Objectives identified to answer the research questions have to be listed, making sure that they are:
- numbered, and
- the statement begins with an action verb.
Methods of Data Collection: There are two types of data
- Primary Data – collected for the first time
- Secondary Data – those which have already been collected and analysed by someone else.
METHODS OF PRIMARY DATA COLLECTION
Observation Method: Commonly used in behavioural sciences. It is the gathering of primary data by the investigator’s own direct observation of relevant people, actions, and situations without asking from the respondent.
Survey Method: Survey Method Approach is most suited for gathering descriptive information.
Contact Methods: Information may be collected by
- Telephone
- Personal interview
Experiment Methods: Also called Empirical Research or Cause and Effect Method, it is data-based research, coming up with conclusions that are capable of being verified with observation or experiment.
Experimental research is appropriate when the proof is sought that certain variables affect other variables in some way. e.g.
- Tenderisers (independent variable) affect cooking time and texture of meat( dependent variable) .
- The effect of substituting one ingredient in whole or in part for another such as soya flour to flour for making high protein bread.
- Develop recipes to use products.
Further Reading: Research Methods | Experimental, Historical, Descriptive, Qualitative and Quantitative
Determining Sample Design:
Researchers usually draw conclusions about large groups by taking a sample.
A Sample is a segment of the population selected to represent the population as a whole. Ideally, the sample should be representative and allow the researcher to make accurate estimates of the thoughts and behaviour of the larger population.
Types of Sampling:
- Probability sampling: A sampling procedure in which each element of the population has a fixed probabilistic chance of being selected for the sample.
- Non-probability sampling: Sampling techniques that do not use chance selection procedures but rather rely on the personal judgment of the researcher.
Probability sampling is further divided into the following:
1. Simple Random Sample: A probability sampling technique in which each element has a known and equal probability of selection. Every element is selected independently of every other element, and the sample is drawn by a random procedure from a sampling frame. This method is equivalent to a lottery system in which names are placed in a container, the container is shaken, and the names of the winners are then drawn out in an unbiased manner. To draw a simple random sample, the researcher first compiles a sampling frame in which each element is assigned a unique identification number. Then random numbers are generated to determine which elements to include in the sample.
2. Systematic Sampling: In systematic sampling, the sample is chosen by selecting a random starting point and then picking every ith element in succession from the sampling frame.25 The sampling interval, i, is determined by dividing the population size N by the sample size n and rounding to the nearest whole number. For example, there are 100,000 elements in the population, and a sample of 1,000 is desired. In this case, the sampling interval, i, is 100. A random number between 1 and 100 is selected. If, for example, this number is 23, the sample consists of elements 23, 123, 223, 323, 423, 523, and so on.
3. Stratified Random Sample: Population is divided into mutually exclusive (heterogeneous) groups (strata) then random sampling is drawn from each group (stratum).
It is a two-step process in which the population is partitioned into subpopulations or strata. The strata should be mutually exclusive and collectively exhaustive in that every population element should be assigned to one and only one stratum and no population elements should be omitted. Next, elements are selected from each stratum by a random procedure, usually Simple Random Sampling.
4. Cluster (area) sample: The population is divided into mutually exclusive groups (Homogeneous) such as blocks, and the researcher draws a sample of the group to interview.
A two-step probability sampling technique where the target population is first divided into mutually exclusive and collectively exhaustive sub-populations called clusters, and then a random sample of clusters is selected based on a probability sampling technique such as SRS. For each selected cluster, either all the elements are included in the sample, or a sample of elements is drawn probabilistically.
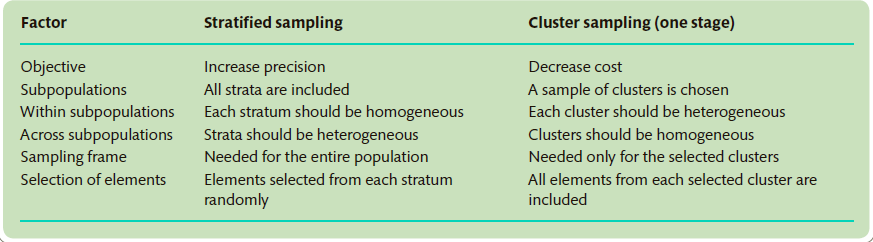
Differences between Stratified Sampling and Cluster Sampling
(Source: Marketing Research, Malhotra)Non-Probability Sampling is further divided into the following:
1. Convenience sampling: Convenience sampling attempts to obtain a sample of convenient elements. The selection of sampling units is left primarily to the interviewer. Often, participants are selected because they happen to be in the right place at the right time.
2. Judgemental sampling: It is a form of convenience sampling in which the population elements are selected based on the judgement of the researcher. The researcher, exercising judgement or expertise, chooses the elements to be included in the sample because it is believed that they are representative of the population of interest, or are otherwise appropriate.
3. Quota sampling: It is a two-stage restricted judgemental sampling. The first stage consists of developing control categories or quotas of population elements. In the second stage, sample elements are selected based on convenience or judgement.
4. Snowball Sampling: A strategy used to gather a sample for a research study, in which study participants give the researcher referrals to other individuals who fit the study criteria. Snowball samples cannot be generalized to the population because they are not selected randomly. Snowball samples are usually used to investigate groups that have some unique, rare, or unusual quality and groups in which members know each other through an organization or common experience. For example, snowball samples might be used to identify marathon runners or cancer survivors who attend support groups.
TOOL FOR DATA COLLECTION (RESEARCH INSTRUMENTS)
The construction of a research instrument or tool for data collection is the most important aspect of a research project because anything you say by way of findings or conclusions is based up the type of information you collect, and the data you collect is entirely dependent upon the questions that you ask of your respondents. The famous saying about computers- “garbage in garbage out”- is also applicable for data collection. The research tool provides the input into study, and therefore, the quality and validity of the output (the findings), are solely dependent on it.
Guidelines to Construct a Research Tool:
The underlying principle behind the guidelines suggested below is to ensure the validity of your instrument by making sure that your questions relate to the objectives of your study.
Step I: Clearly define and individually list all the specific objectives or research Questions for your study.
Step II: For each objective or research questions, list all the associated questions That you want to answer through your study.
Step III: Take each research question listed in step II and list the information required to answer it.
Step IV: Formulate question(s) to obtain this information.
Questionnaire:
A questionnaire consists of a set of questions presented to a respondent for answers. The respondents read the questions, interpret what is expected and then write down the answers themselves.
Interview Schedule: It is called an Interview Schedule when the researcher asks the questions (and if necessary, explain them) and record the respondent’s reply on the interview schedule.
Because there are many ways to ask questions, the questionnaire is very flexible. The questionnaire should be developed and tested carefully before being used on a large scale.
There are three basic types of a questionnaire:
- Closed-ended
- Open-ended
- Combination of both
Step 5: Collection of Data
Having formulated the research problem, developed a study design, constructed a research instrument, and selected a sample, then collect the data from which you will draw inferences and conclusions for the study. Depending upon your plans, you might commence interviews, mail out a questionnaire, conduct experiments and/or make observations.
Step 6: Processing and Analysing Data
Processing and analysing data involves a number of closely related operations which are performed with the purpose of summarizing the collected data and organizing these in a manner that they answer the research questions(objectives).
The Data Processing operations are:
1. Editing- a process of examining the collected raw data to detect errors and omissions and to correct these when possible.
2. Classification– a process of arranging data in groups or classes on the basis of common characteristics. Depending on the nature of the phenomenon involved.
3. Tabulation– Tabulation is the process of summarizing raw data and displaying the same in compact form for further analysis. It is an orderly arrangement of data in columns and rows. Tabulation is essential because:
- It conserves space and reduces explanatory and descriptive statements to a minimum.
- It facilitates the process of comparison.
- It facilitates the summation of items and the detection of errors and omissions.
- It provides the basis for various statistical computations.
Tabulation may also be classified as simple and complex tabulation. Simple tabulation generally results in one-way tables that supply answers to questions about one characteristic of data only. Complex tabulation usually results on two-way tables (which give information about two inter-related characteristics of data), three-way tables or still higher-order tables, also known as manifold tables.
Also Read: How to Write A Research Paper
Data Analysis Methods:
Qualitative Data Analysis: Qualitative data analysis is a very personal process with few rigid rules and procedures. For this purpose, the researcher needs to go through a process called Content Analysis.
Content Analysis means analysis of the contents of an interview in order to identify the main themes that emerge from the responses given by the respondents.
Quantitative Data Analysis: This method is most suitable for large well designed and well-administered surveys using a properly constructed and worded questionnaire. Data can be analysed either manually or with the help of a computer.
Data Analysis Using a Computer: If you want to analyse data using a computer, you should be familiar with the appropriate program. In this area, knowledge of computers and statistics plays an important role.
The most common software is SPSS. However, data input can be a long and laborious process, and if data is entered incorrectly, it will influence the final results.
Step 7: Reporting the Findings
Writing the report is the last, and for many, the most challenging stage of the research process. The report informs the world what you have done, what you have discovered, and what conclusions you have drawn from your findings. The report should be written in an academic style. Language should be formal and not journalistic.
Further reading: How to Write a Research Report or Article
Related Topics:
UGC NET Syllabus (Updated): Paper 1 and 2 (Download)
Solved Question Papers of UGC NET Paper 1
UGC NET Study Materials for Paper 1 (Download PDF)
MPhil and PhD Fellowship